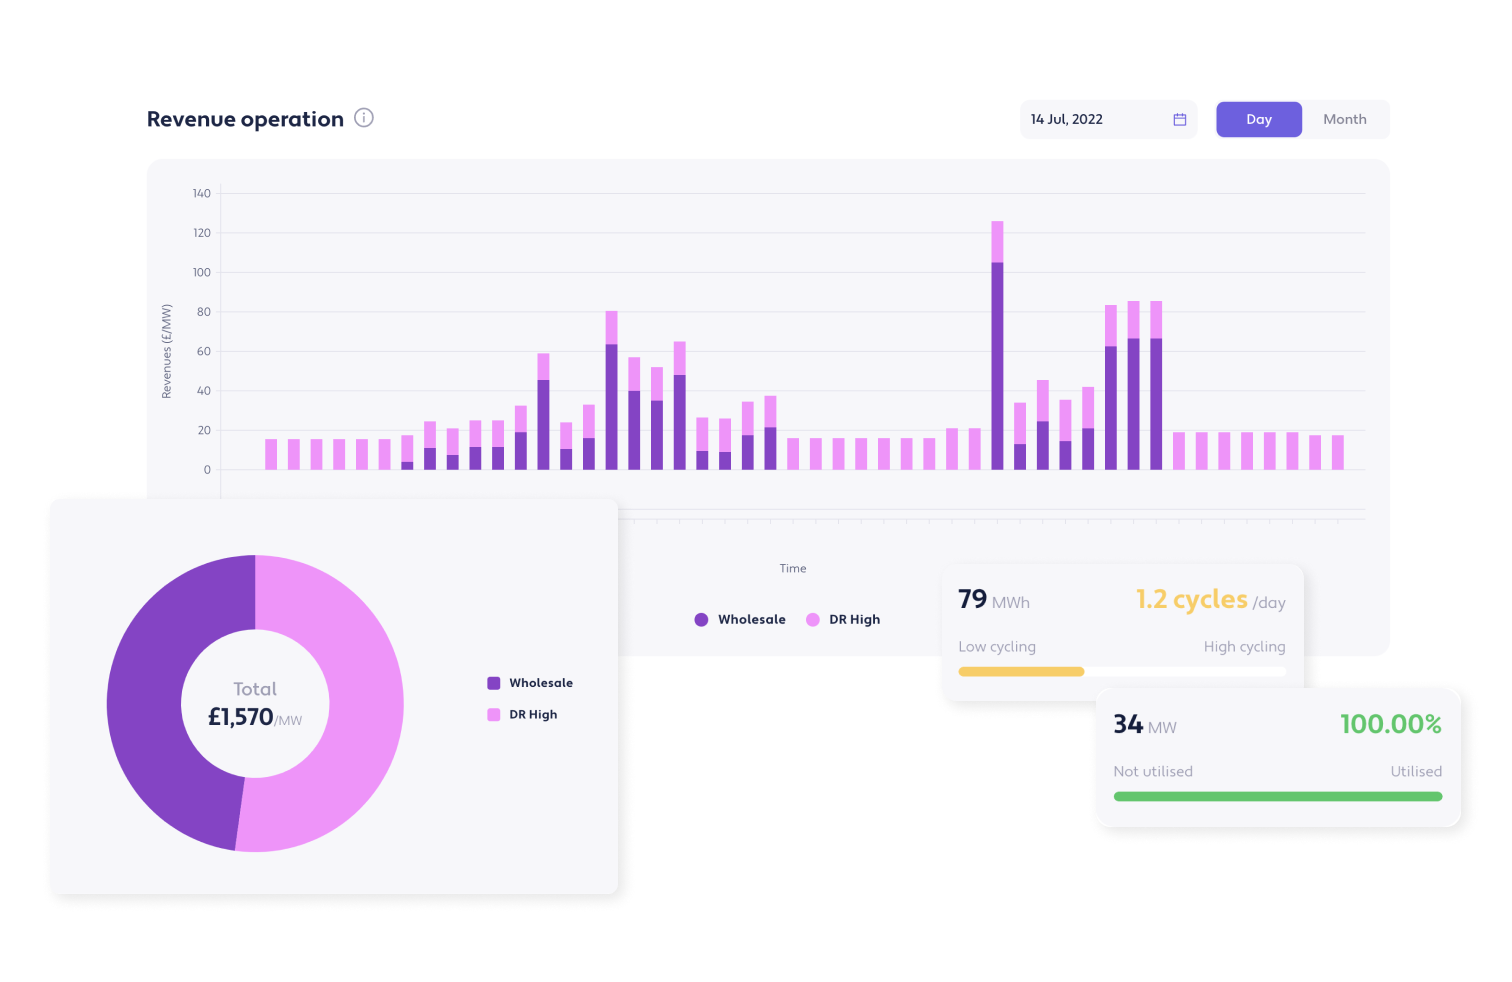
Ever wondered what your favourite battery energy storage asset is up to? What did it do on a specific day? What markets was it in? Where did it make its highest revenues? How much cycling did it see over a month? What was the balance of ancillary services vs. merchant activity?
With our new Asset Operations tab, you can take a deep dive into any asset on the Leaderboard - to answer all these questions and more! Our goal is to give you the most granular data we can (half-hourly), while also allowing you to zoom out and see the big picture (monthly view)! We’ve also included some high-level "asset health indicators", such as Throughput (cycles) and Contracted Power (%).
This is our most requested feature ever - thank you to everyone who told us they wanted it! But remember - this is only our first version, so we will be regularly iterating and improving on this feature. If there’s anything you think we can improve, don’t hesitate to let us know.
