Changelog
Follow up on the latest improvements and updates.
RSS
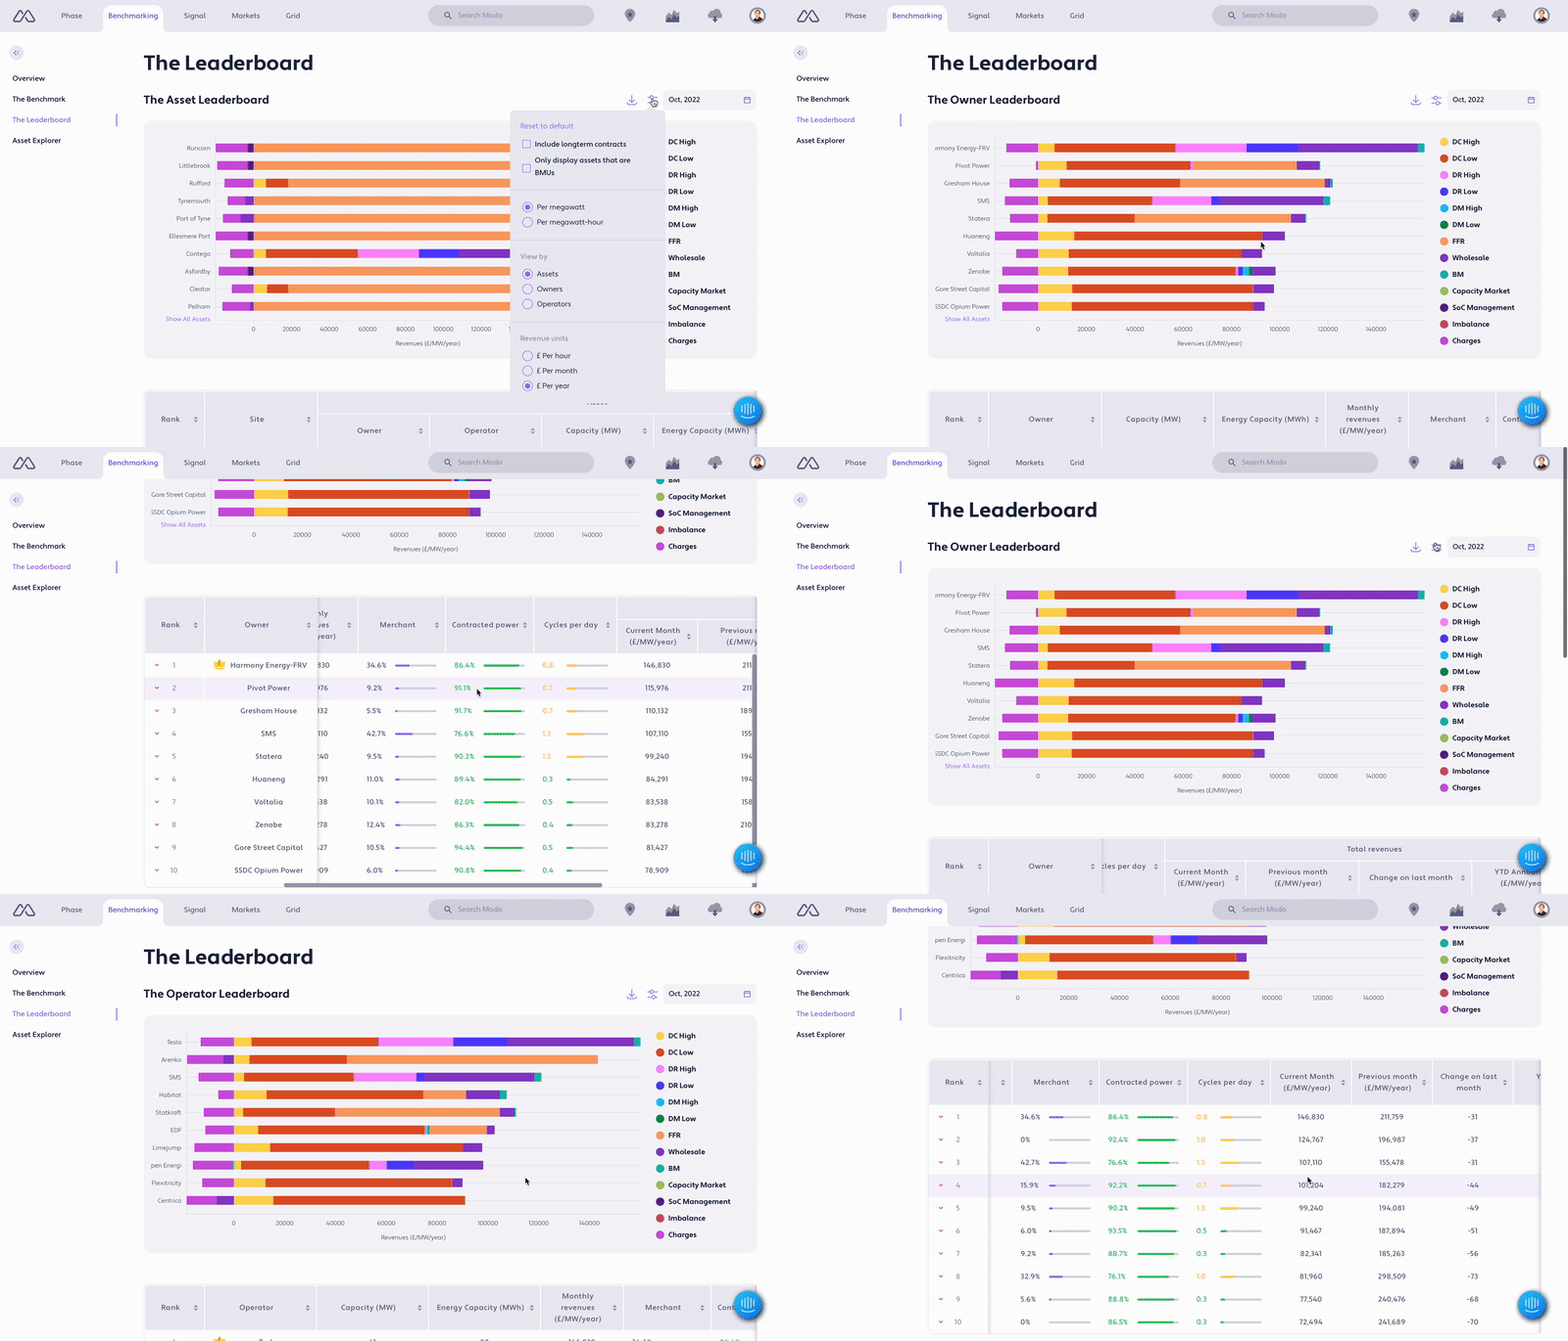
Until now, the Leaderboard has shown the performance of individual battery energy storage systems (BESS) across Great Britain. A tool so powerful that over 90% of BESS are owned and/or operated by its users.
But you wanted more. Loads of Modo users were taking the Leaderboard data and aggregating asset performance to compare owners and operators.
You can now step between views of the Leaderboard in seconds.
Assets. Owners. Operators.
Your full team can now instantly benchmark your own strategy without even mentioning Excel.
Interpreting the Leaderboard
A few important points:
Owner and Operator views only include the performance of Balancing Mechanism Units (BMUs).
The Leaderboard is a great indication of market performance. It can highlight how factors like risk appetite and age, size, and duration of assets can impact performance.
But there are details that aren’t included in the Leaderboard that can impact the real performance of these assets. For example, performance penalties for failing to deliver in accordance with Balancing Services’ requirements.
For more on what is and isn’t included in our benchmarking, we’d recommend you read Interpreting the Leaderboard.
If you’re looking at working with operators then we’d recommend checking out our series on choosing an operator.
If you ever have any questions on the Leaderboard or need support interpreting what’s being shown then please get in touch. We’re always happy to chat.
Show me the money (per hour and per year please!)
The Leaderboard currently updates once every month. And so we’ve always shown revenues in £/month. With our latest release you can now benchmark performance quickly in any conversation, and view revenues on a £/hour and £/year basis. Choose the units that make the most sense to you!
There’s more in the Leaderboard...
Other improvements we’ve made (all based on your feedback):
The methodology:
Charges (as shown in the Leaderboard chart) are now an aggregation of all Use of System charges - now including embedded export Transmission Network Use of System charges (TNUoS) from Triads.
We’ve made our throughput calculations more accurate (used in Asset Operations pages and in calculating Cycles per day in the Leaderboard), now using net traded volumes rather than export wholesale volumes.
We now calculate wholesale revenues using the average of the EPEX hourly and N2EX hourly Day Ahead auctions (previously, it was just the N2EX auction).
Revenues and costs due to imbalance are now shown as a distinct revenue stream for assets that aren’t registered as Balancing Mechanism Units (BMUs).
We’ve adjusted our assumption on round trip efficiency for calculating state of charge management for non-BMUs. Rather than assuming symmetric bi-directionally efficiencies of 92%, we now assume 85% on import and 99% on the export.
The experience:
Quickly see which assets are Balancing Mechanism Units (BMUs) and filter to only include BMUs.
With the Leaderboard graph making the revenue stack easier to understand, we’ve simplified the Leaderboard table by removing individual markets. Don't worry - these are still available to download. But it's now easier to see the headline figures (monthly revenues, merchant %, contracted power %, cycles, previous month, YTD annualised).
We’ve rounded revenues to the nearest £ (except when viewing revenues in hourly terms).
Changes to the benchmark:
The benchmark now only includes data taken from BMUs. We have a more accurate picture of what these assets are doing.
We've removed fixed Distribution Use of System (DUoS) charges and Capacity Market (CM) contracts from the benchmark figures. This will give a more accurate reference point when comparing day-to-day operations.
Historic benchmarks will be available (initially via the Modo team) and we will backdate all previous months using the new calculations.
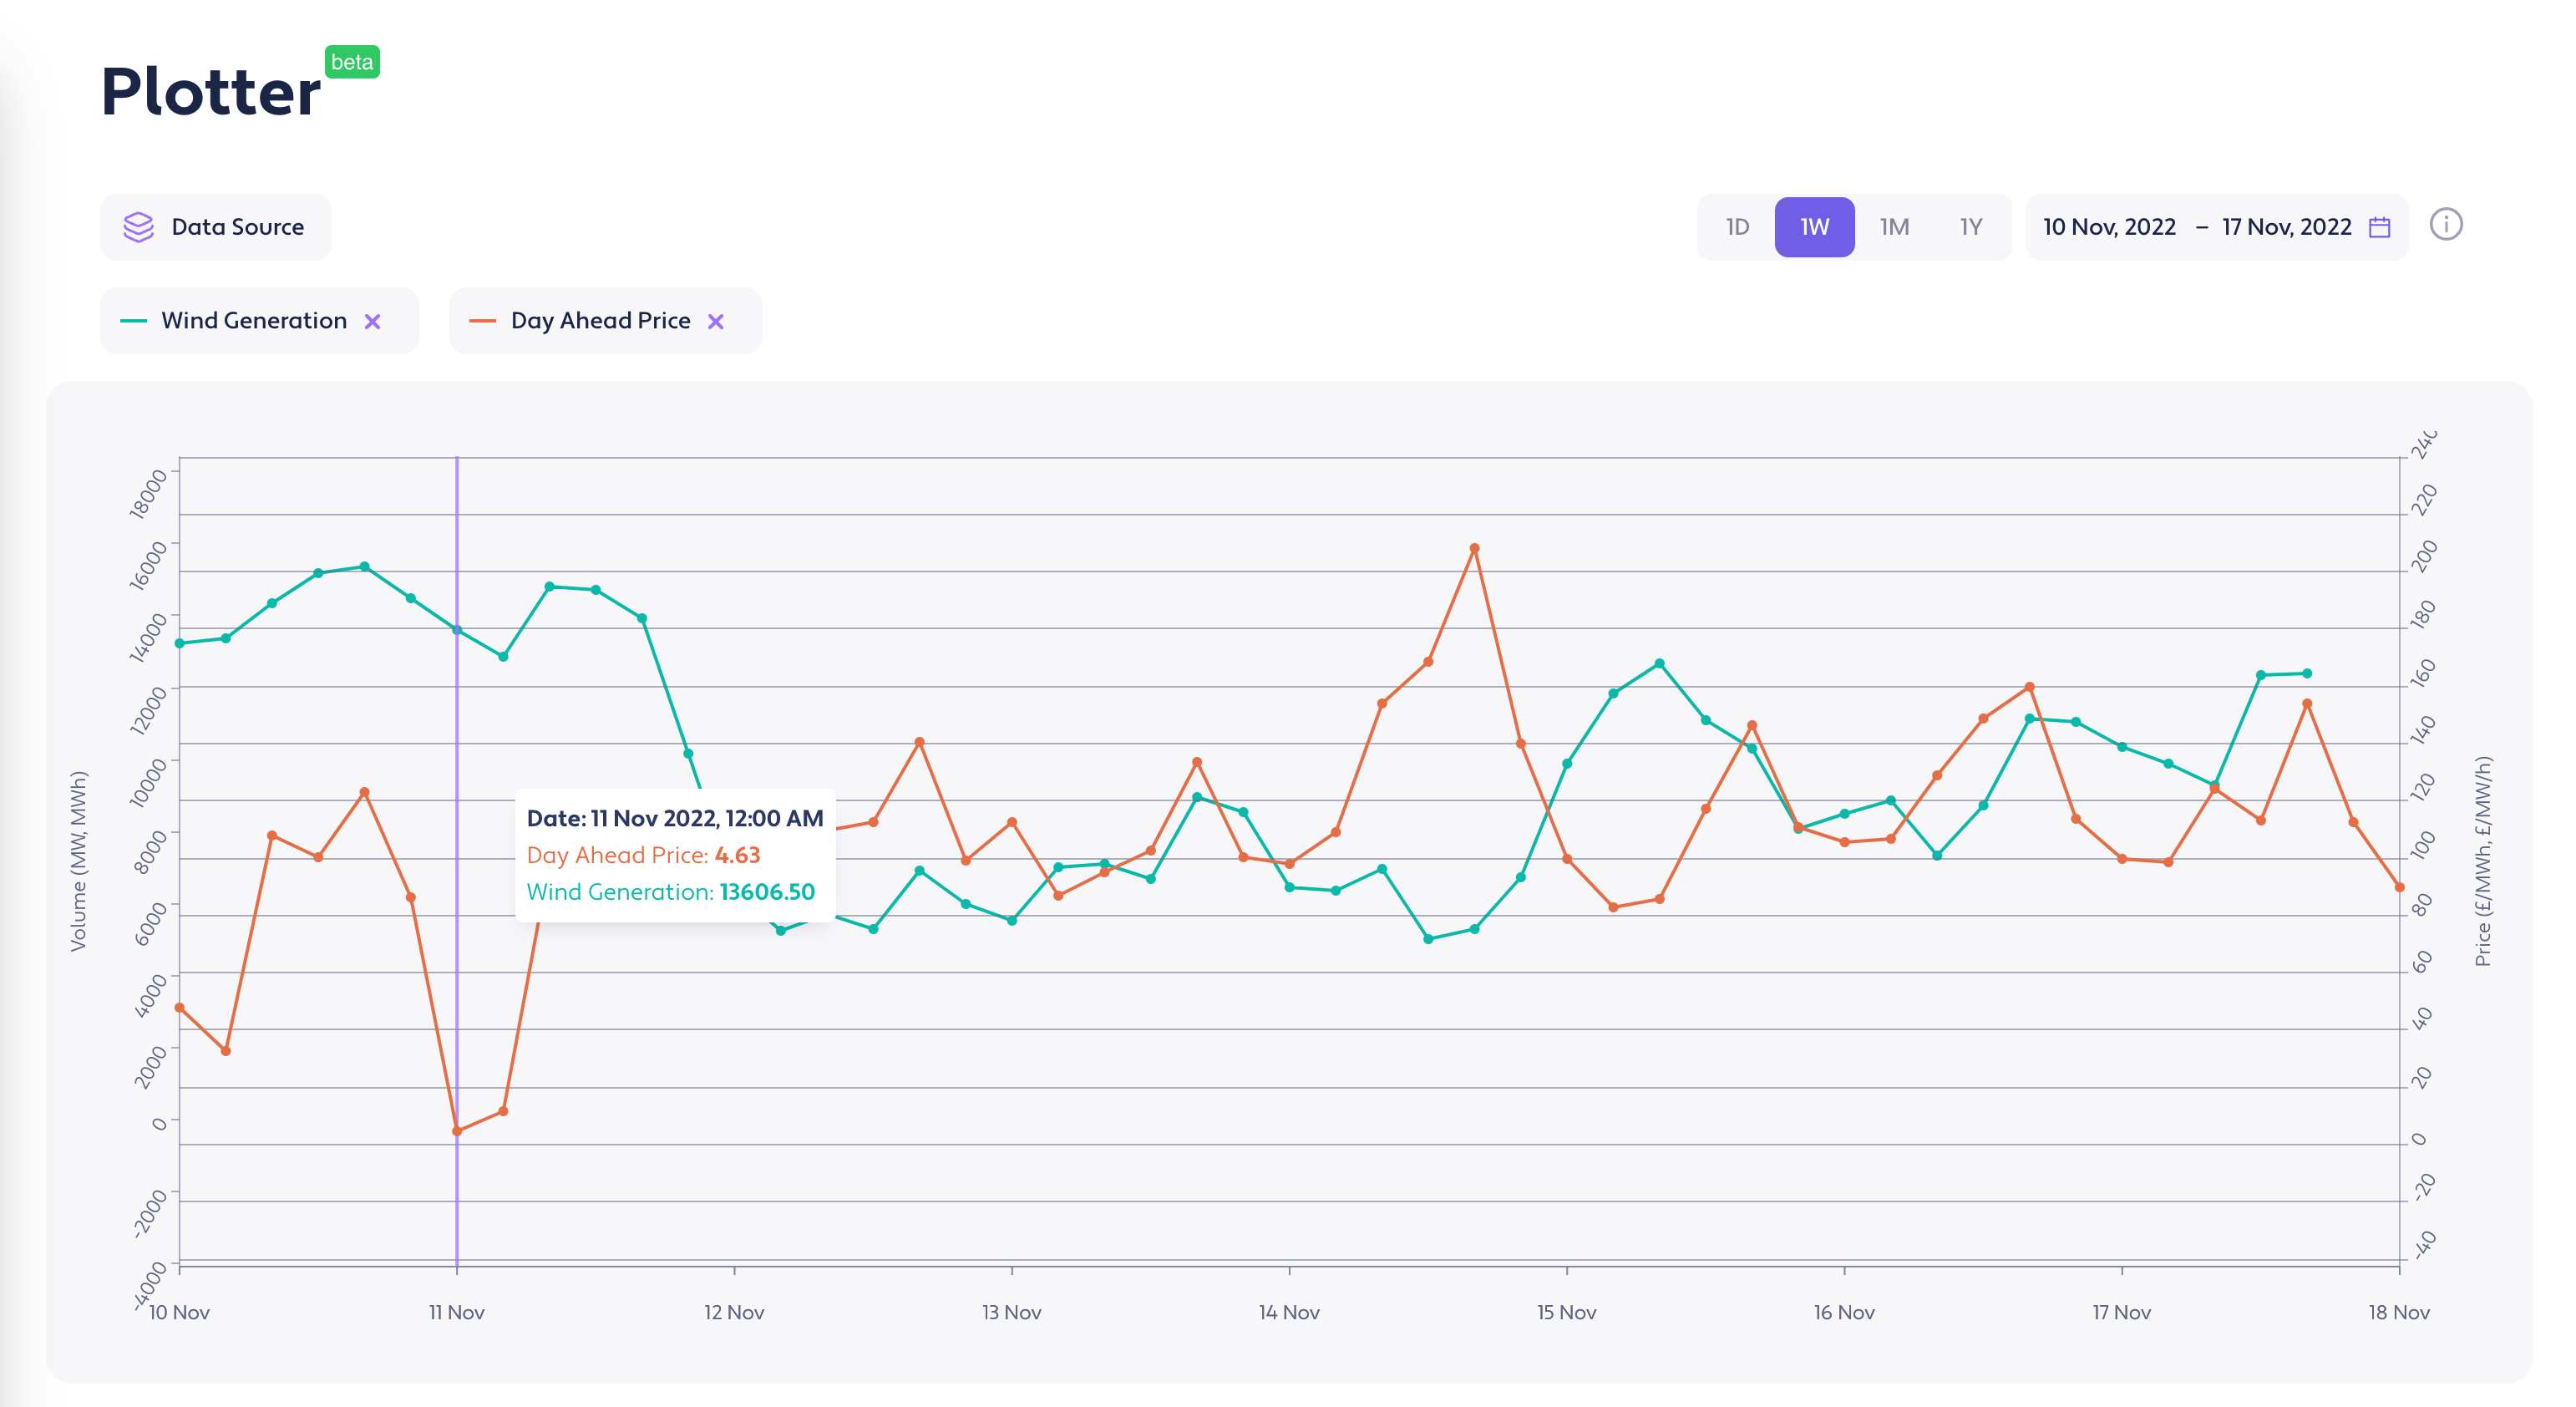
Easily create customized plots from Modo data - select the data sets you want, the time period to chart and that's it!
We will be adding more data sets over the course of Q1 2023. Let us know what datasets you would like to see added!
benchmark | ˈbɛn(t)ʃmɑːk |
verb [with object]
evaluate (something) by comparison with a standard: we benchmark our performance against external criteria.
One of the most valuable aspects of the Modo Asset Success Platform is our Benchmarking section. This enables you to evaluate battery energy storage asset performance against various Modo market Benchmarks - to give you comparative insights and points of reference in an ever-evolving market.
So, when we decided to make improvements to our Benchmarking features, we didn’t take them lightly. We gathered a huge amount of feedback from a diverse range of users - you lot! - and aligned your needs with our own vision for battery energy storage Benchmarking. As a result, we’ve made some bold, carefully thought-out improvements to our offering. And we think you’re going to love them!
How has the Benchmark changed?
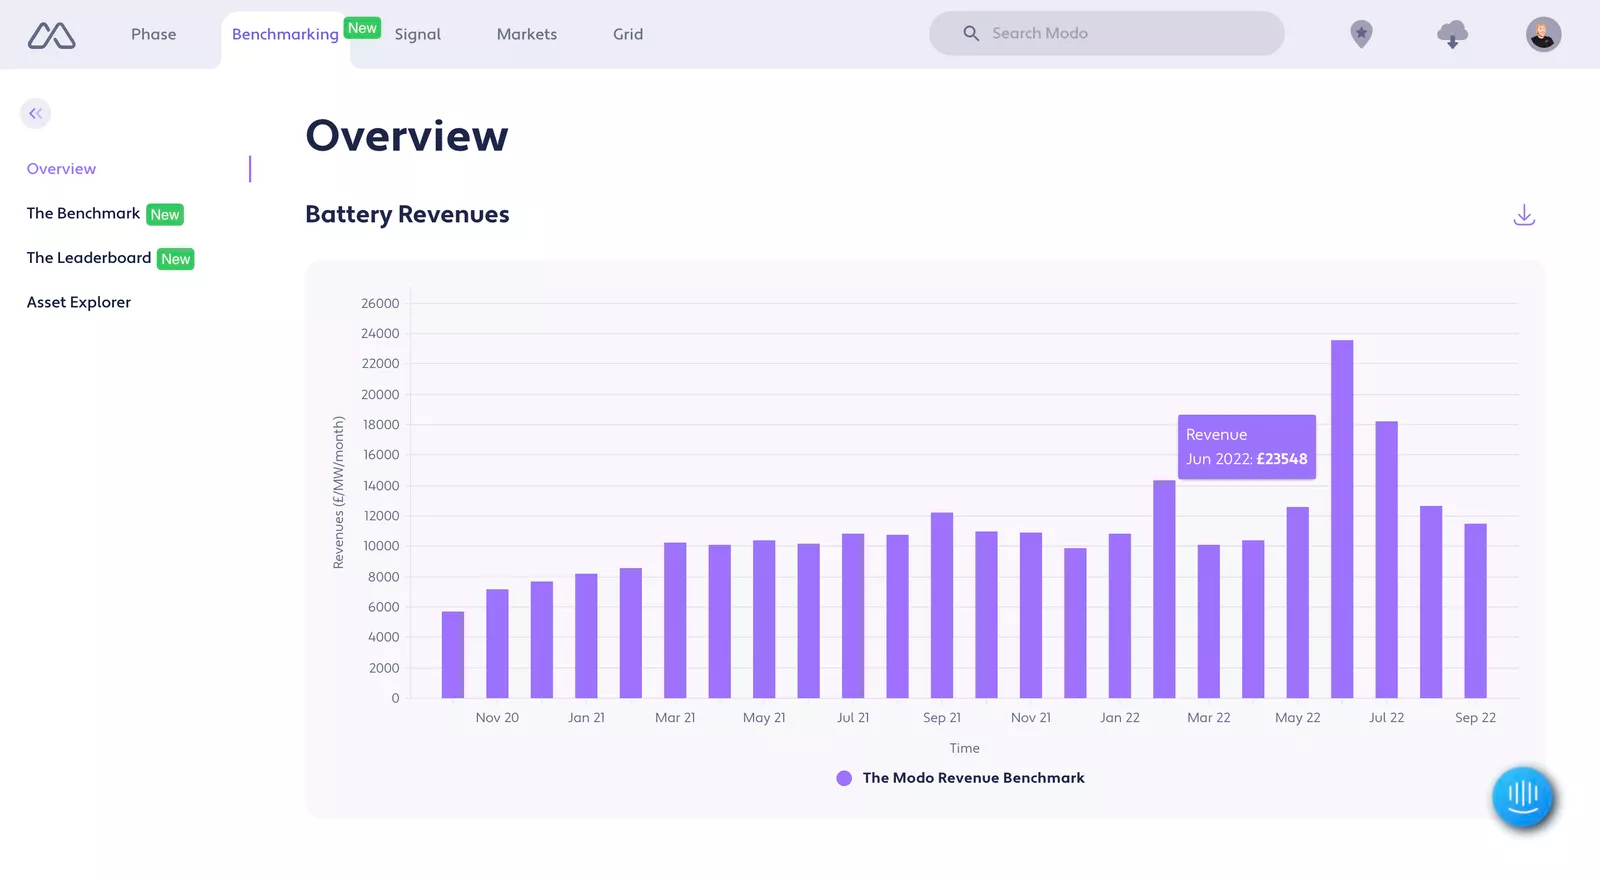
Firstly, we’ve made our Benchmarking tools more visible to more users. Our Monthly Revenue Benchmark, which shows two years of historical market performance, is now available for free!
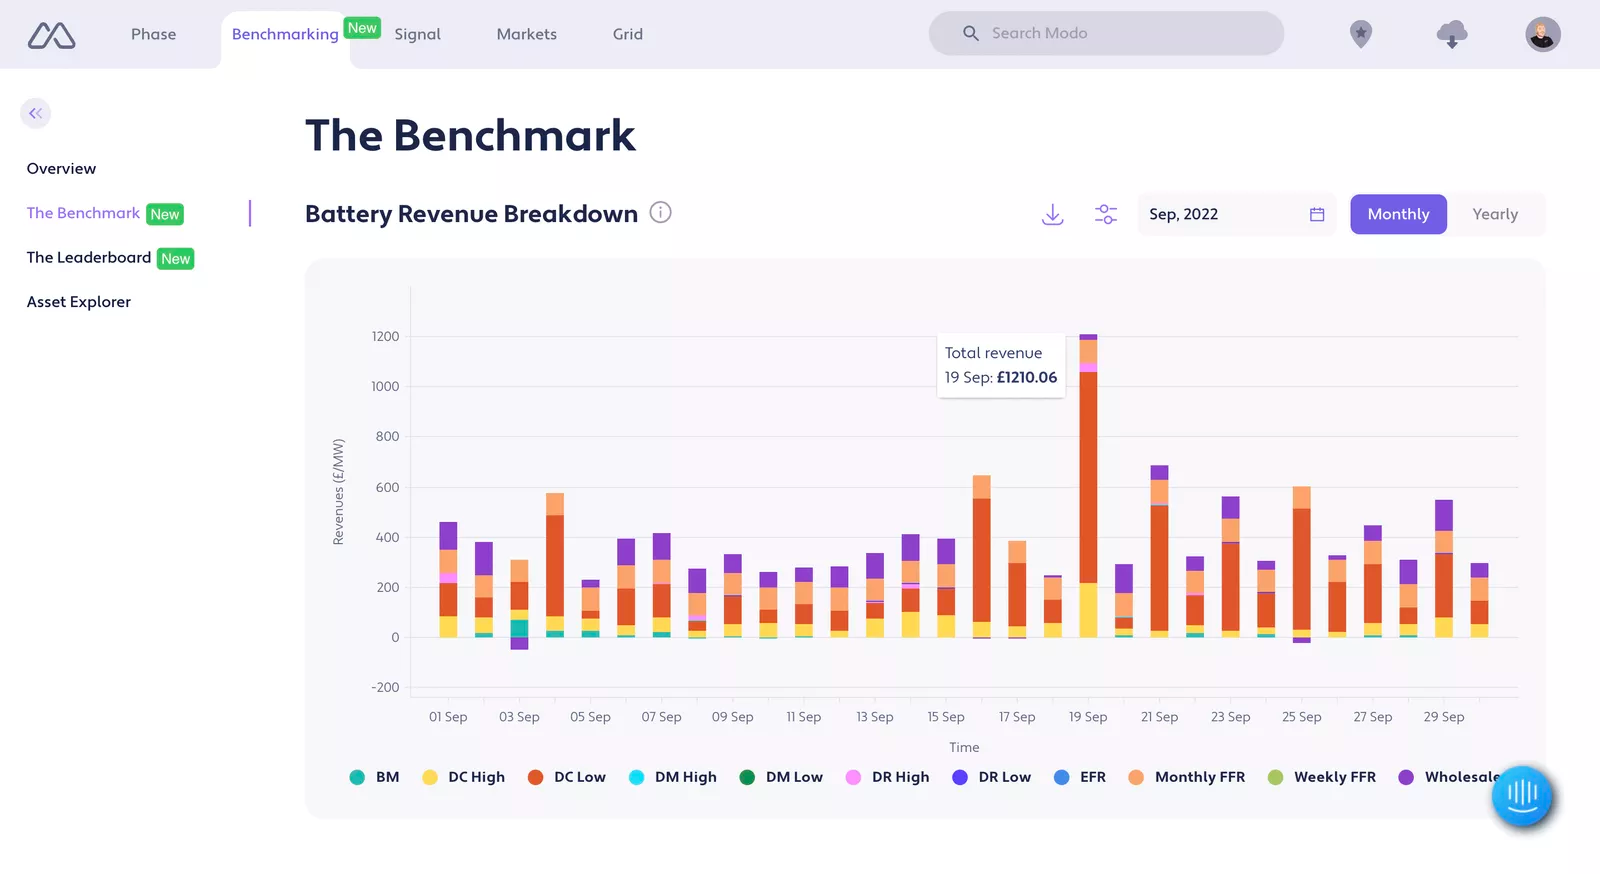
Our more detailed Battery Revenue Breakdown, which shows individual revenue streams on a daily granularity, will now be available on our Starter tier. Want to understand market-wide performance in detail, but don’t need to know what every asset is doing? This is the Benchmarking tool for you!
What about the Leaderboard?
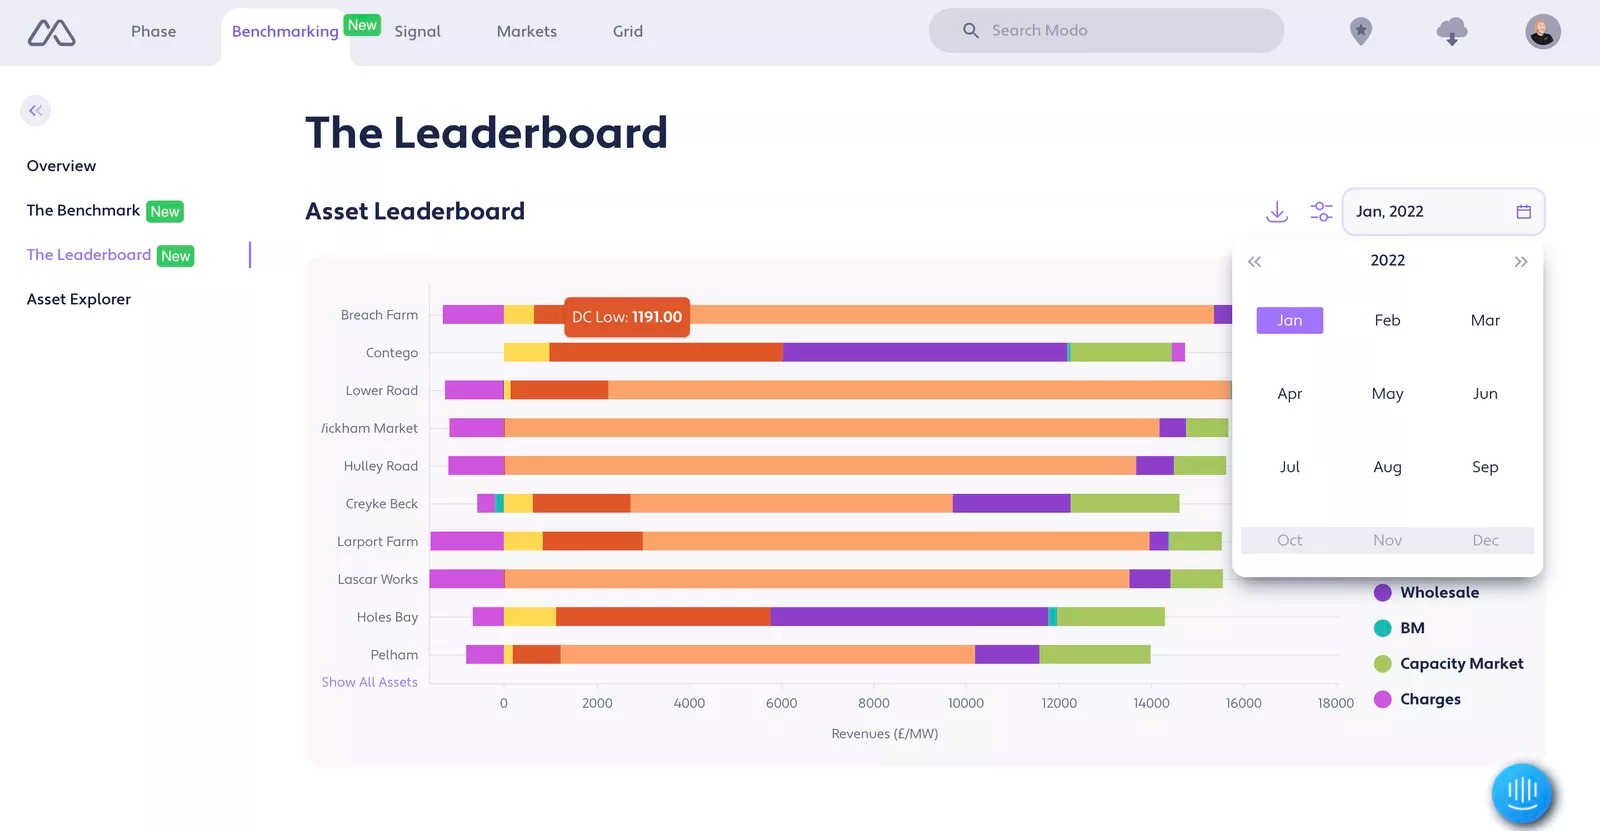
Finally, we’ve made big improvements to the Leaderboard. This is available to Plus and Enterprise users - those of you who require the deepest insights and specific, asset-level data. Our new Leaderboard graph makes it quicker - and even easier - to analyze the revenue stack for top-performing battery assets. You can now spot differences in strategies at a glance!
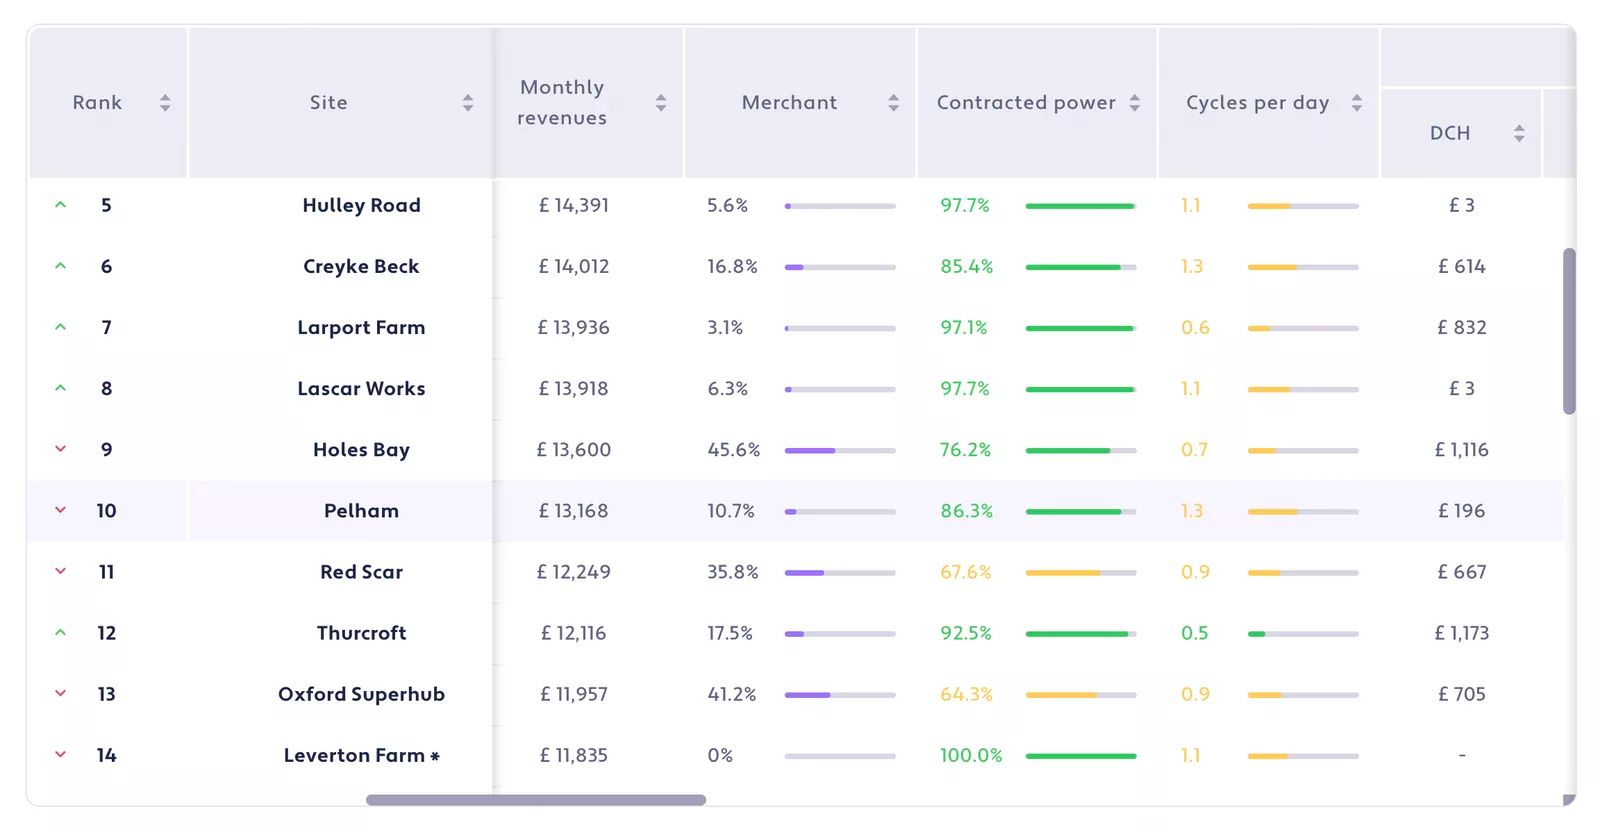
You also told us that you want to compare asset performance more easily. So, you’ll now find three new performance indicators - the percentage of revenues that came from merchant markets; the percentage of an asset’s nameplate capacity (MW) that was entered into frequency response services; estimated cycles per day - visualized on the Leaderboard table itself, allowing rapid comparison of assets.
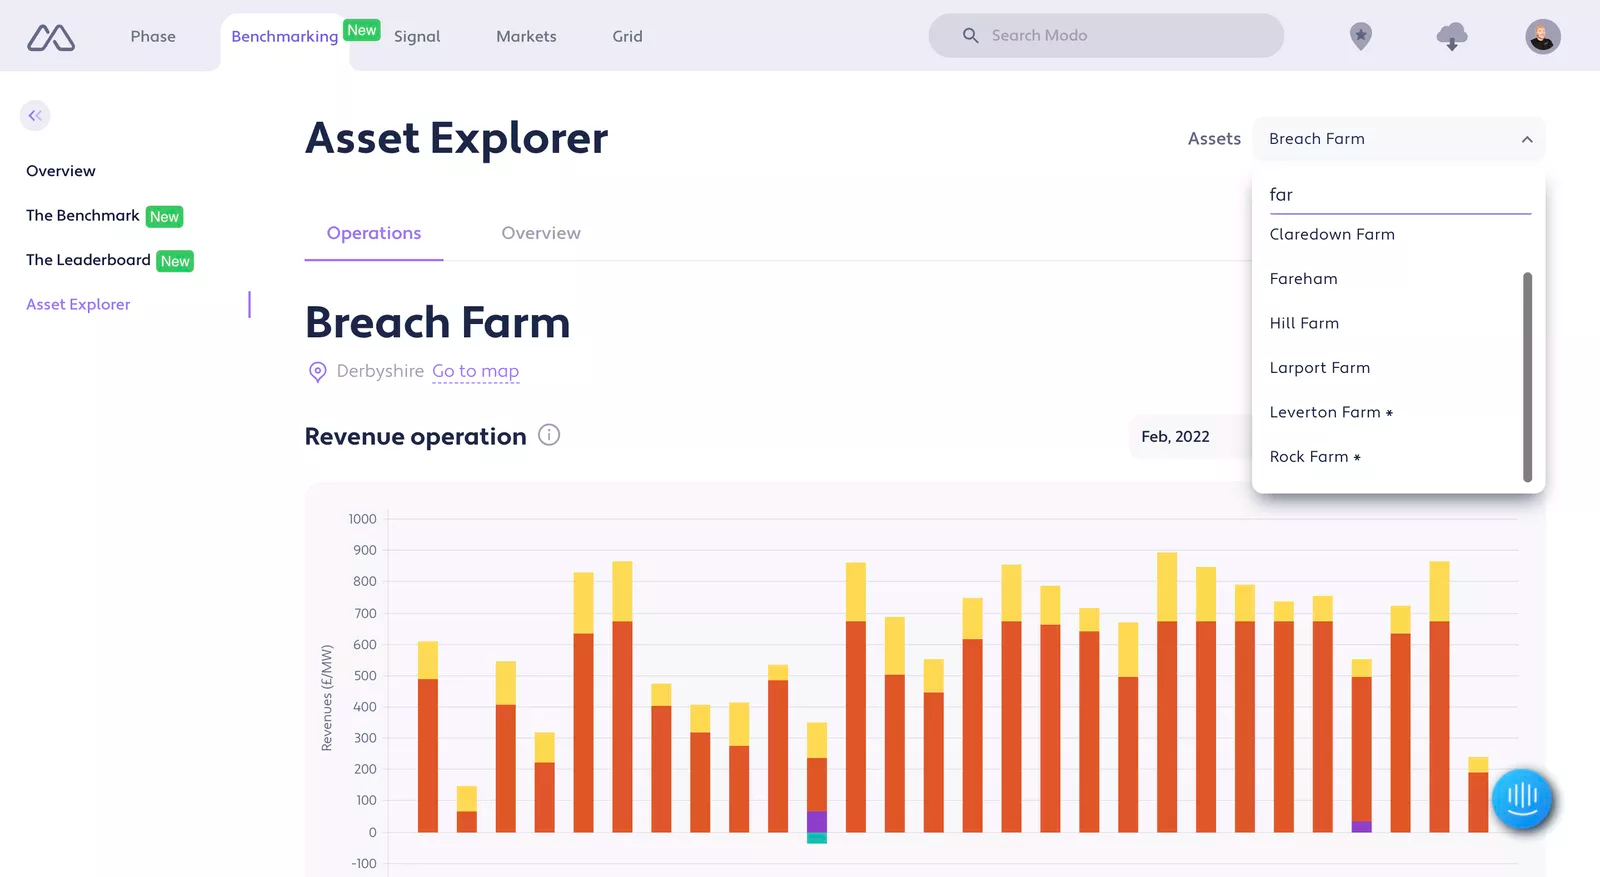
Finally, you can now find our Asset Explorer tool more easily. It’s accessible directly from the Benchmarking side navigation, and you can use the dropdown menu to select any asset. And all the data behind the Asset Explorer is now available to download too!
What are you looking for?
In our last product release (Top Navigation) we hinted that the move to our new design was to
make space
for an upcoming feature. That new feature is here: Global Search, which is now front and (nearly) centre in the top navigation and always available no matter where you are on the Modo platform!Search is something that is almost second nature to us these days, so we don't need to spell out how it works. Just a few points to note:
- You can search for anything and our search will try to return the most relevant results
- The live dropdown menu gives you a quick way to navigate across Modo without needing to complete your search or hitting enter. If you want to see more detailed results, hit enter.
- Search for asset names, owners, operators, manufacturers and more, to see their associated battery assets
- Type the name of a market, a graph, a dataset and it should take you to the relevant page
- Search in Phase, across both Modo content and industry news
new
improved
Navigate to the top!
Look up! 🔝
There's no hiding our latest product release - it's right there for all to see. Can't be missed. Just look up - way up!
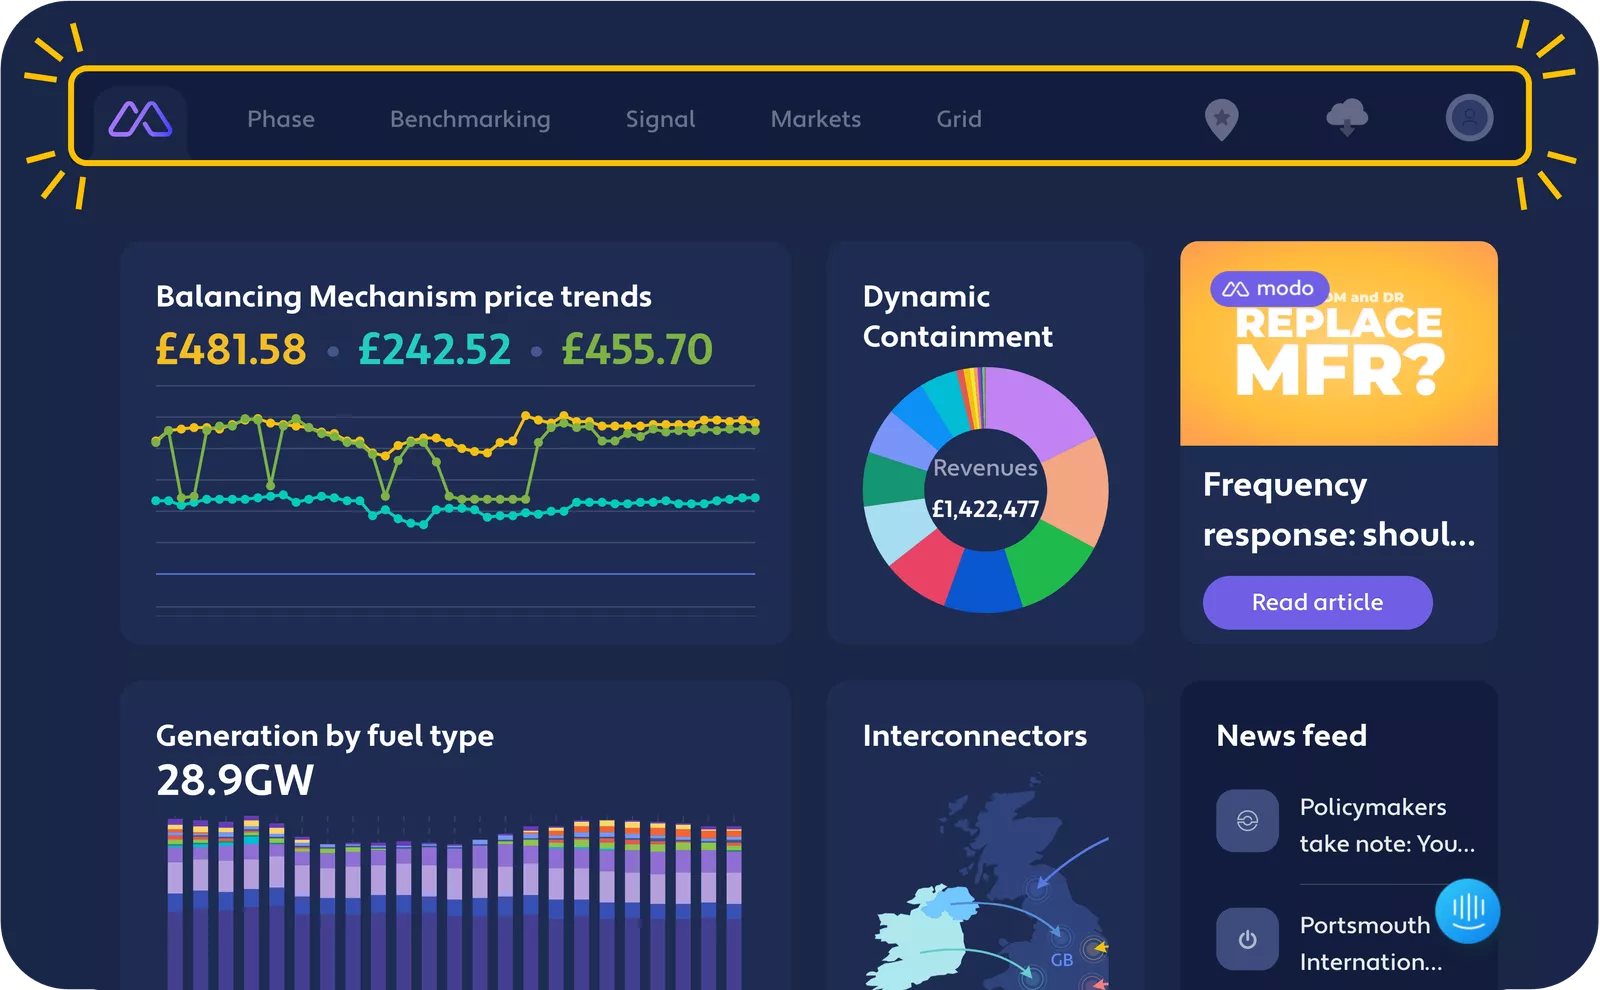
Yes, Modo has a fresh new look and feel! The much-loved Modo left-side navigation, with our borderline cult classic icons, has been retired. As much as the icons were.....iconic, some users also found them slightly confusing. The new top navigation shirks icons for clear titles, making it easier for our users to understand what is available at Modo quickly. You'll also notice we've shuffled the order of the platform sections so that our most popular and highest value features are easier to access.
There are still a few icons on the top right - these are now focused purely on a growing suite of what we call Tools (more coming soon). Tools are multi-purpose and interactive parts of Modo from which you can extract your own insights, for example, our Map and Data Downloads.
Hover on your avatar in the far top right corner, and a dropdown menu will appear, allowing you to quickly switch between dark/light mode (for those late-night Phase article reads) and access all your account settings.
Oh and one more thing: The empty space in the middle of the top nav bar is reserved for something exciting coming soon. Any idea what it could be?
We hope you enjoy the fresh new face of Modo. If you have any comments or feedback, we always want to hear from you - get in touch with our team via the in-app chat or drop us your ideas for new feature requests. Keep making energy storage a success!
We’re super excited to announce the launch of Signal! This is our three-year forward view of battery energy storage revenues in Great Britain.
We’ve built Signal from scratch.
Signal is always learning, evolving and improving. When the market changes, you’ll see the impact straight away. So if National Grid ESO changes its frequency response requirement forecast, or we see a step-change in wholesale prices, or new markets for battery energy storage systems emerge - you’ll be able to see how it will impact your revenues.
We know that to get the most out of Signal, you need to understand how it works. That’s why we’re making it completely transparent. Over the next couple of weeks, we’ll be publishing our entire methodology - so, if you're using Signal in your business model, you can explain how it works, including all the details.
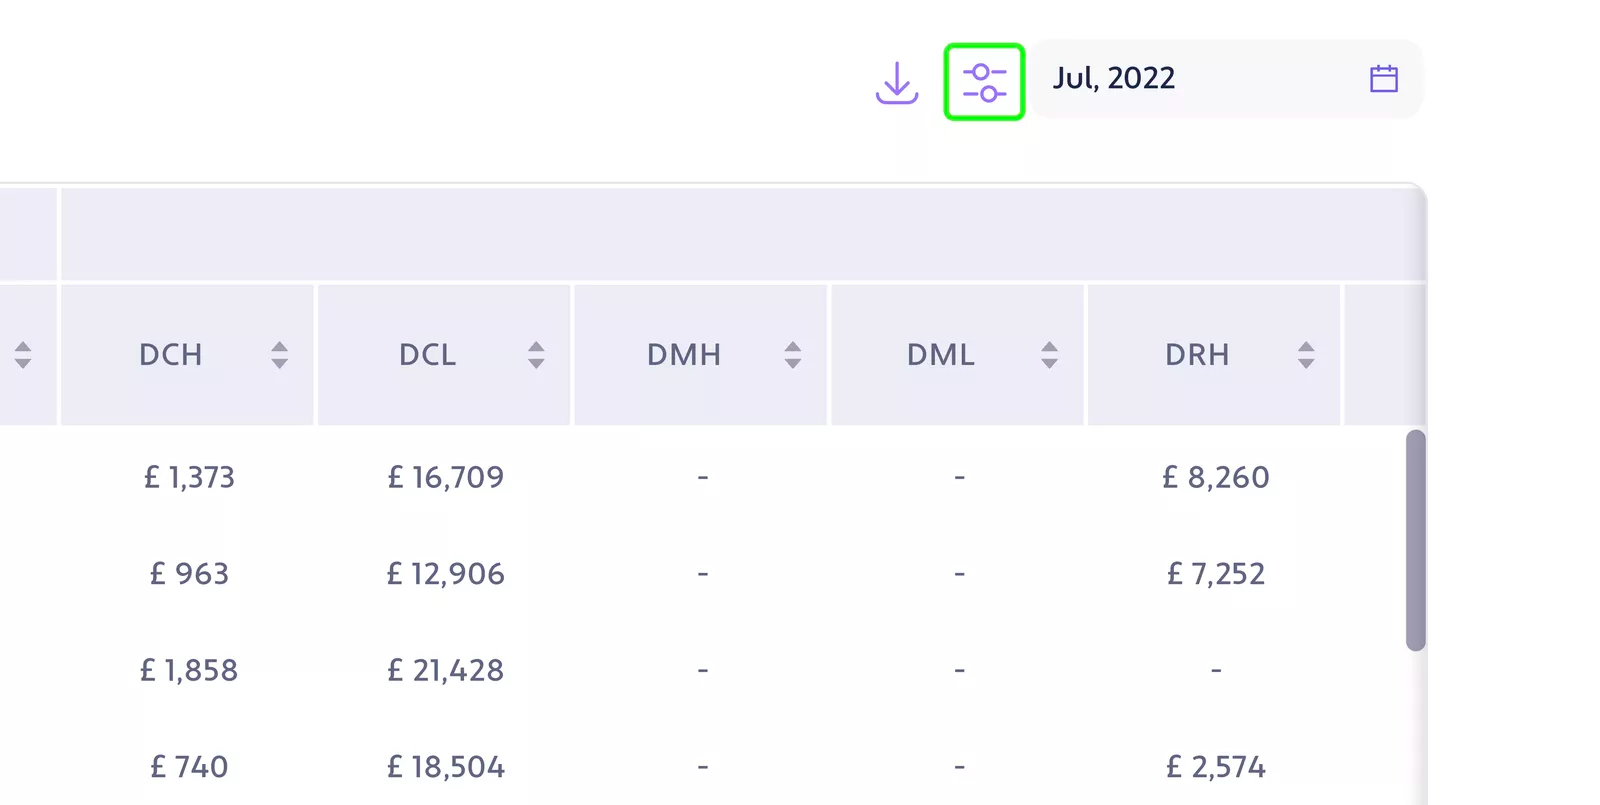
Our asset benchmarking table (a.k.a. the Leaderboard) is one area of the platform that has been through a particularly steep evolution. Over the years, we’ve made tons of changes. So, we figured it was time for a tidy-up. We’ve consolidated all the configuration settings (long-term contracts on/off; MW or MWh normalisation) under a single ‘settings’ button.
Also, to go alongside our new Revenue Benchmark data, we’ve also moved the Leaderboard data to our Data Downloads section. The file format is now a simple CSV, bringing it in line with the rest of our Data Downloads.
new
improved
Download all our Revenue Benchmark data
We know that the Modo Revenue Benchmarks are valuable datasets for our subscribers. Starter subscribers (and above) can now download historical data for the Monthly Revenue Benchmark. Plus subscribers (and above) can access historical data for the Daily Revenue Benchmark. Both datasets are also available on our API.
Also, to go alongside our new Revenue Benchmark data, we’ve also moved the Leaderboard data to our Data Downloads section. The file format is now a simple CSV, bringing it in line with the rest of our Data Downloads.

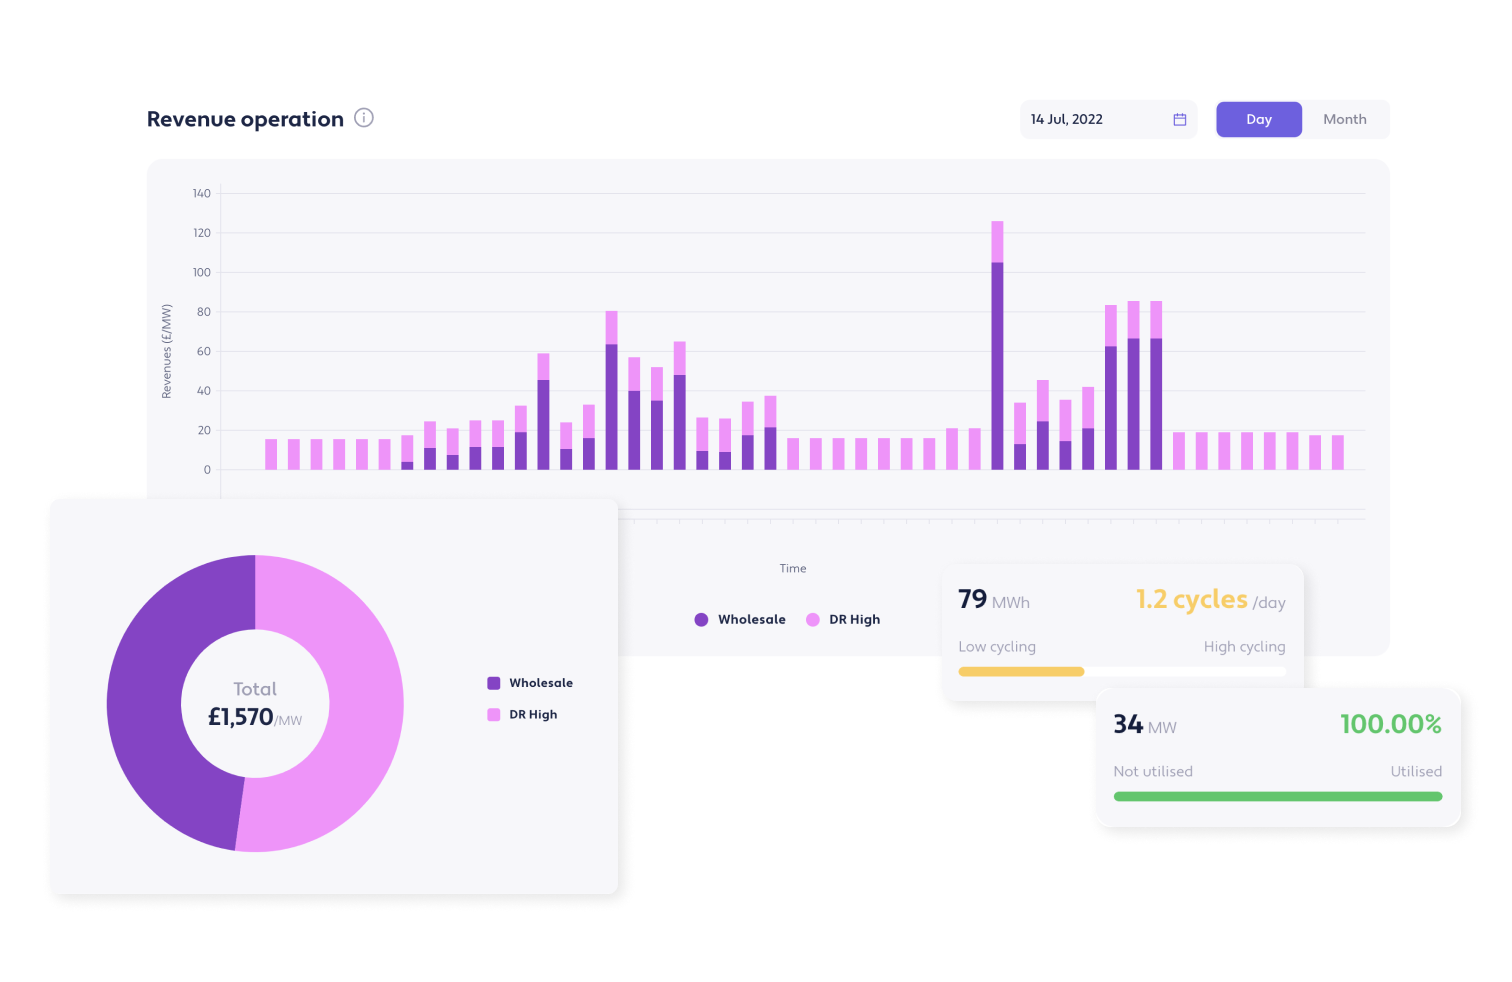
Ever wondered what your favourite battery energy storage asset is up to? What did it do on a specific day? What markets was it in? Where did it make its highest revenues? How much cycling did it see over a month? What was the balance of ancillary services vs. merchant activity?
With our new Asset Operations tab, you can take a deep dive into any asset on the Leaderboard - to answer all these questions and more! Our goal is to give you the most granular data we can (half-hourly), while also allowing you to zoom out and see the big picture (monthly view)! We’ve also included some high-level "asset health indicators", such as Throughput (cycles) and Contracted Power (%).
This is our most requested feature ever - thank you to everyone who told us they wanted it! But remember - this is only our first version, so we will be regularly iterating and improving on this feature. If there’s anything you think we can improve, don’t hesitate to let us know.
improved
new
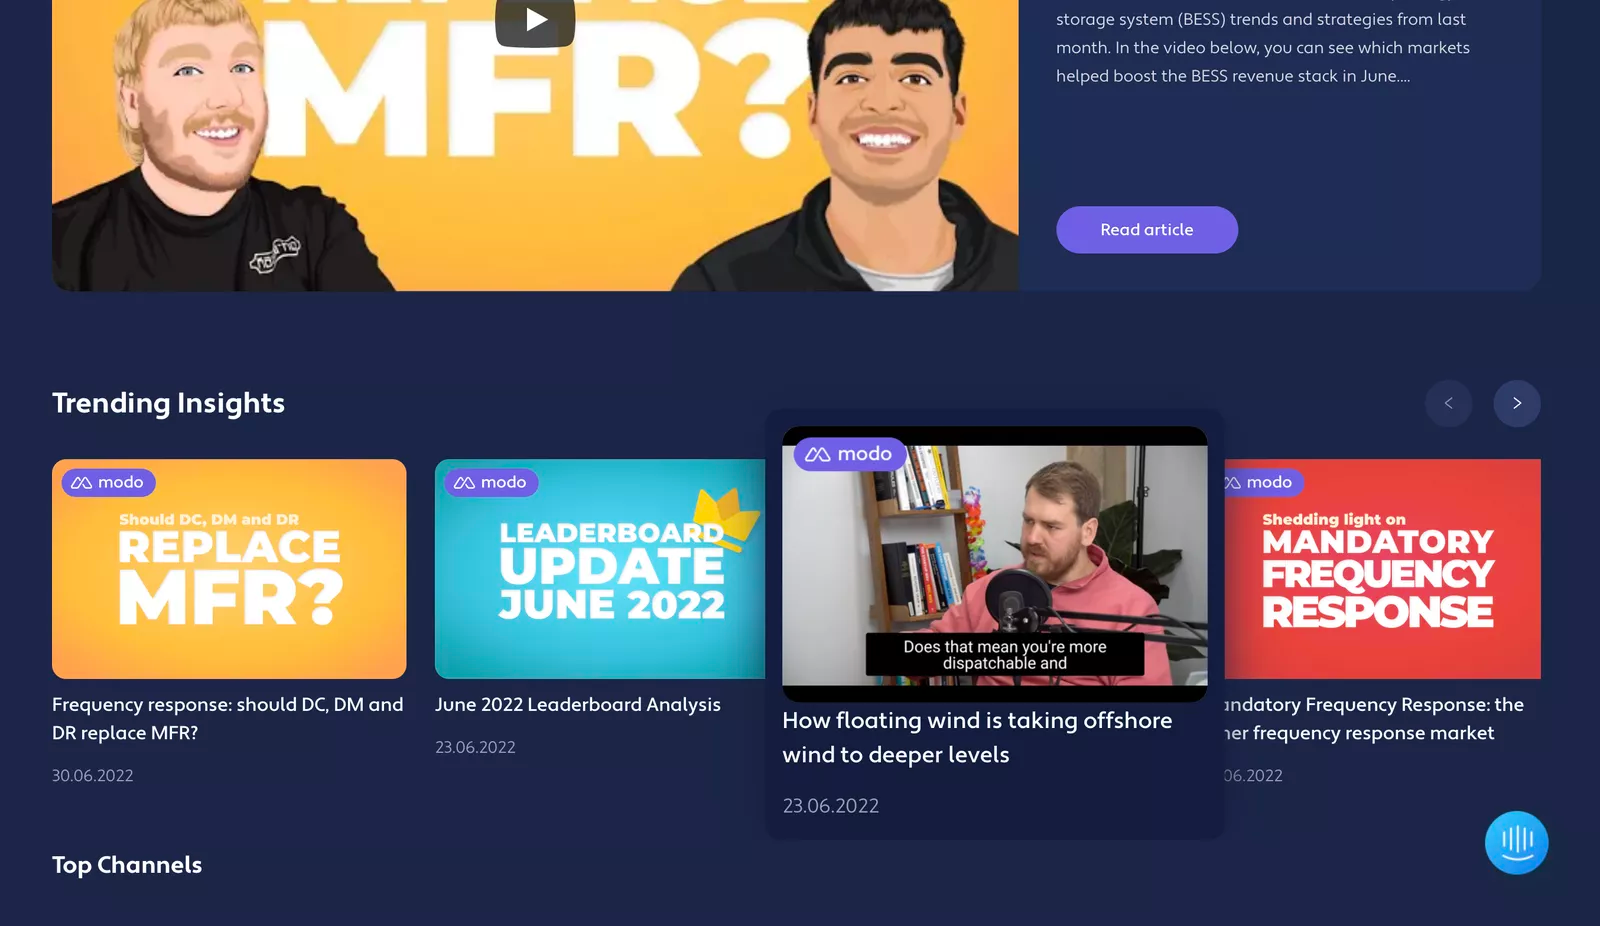
Video previews in Phase
It should come as no surprise that we at Modo are huge fans of video. We are always pushing to put out more high-impact video content that gets you the information you need, as quickly as possible. So we decided to bring those videos right to the surface of Phase by providing previews of the videos inside our articles. Video previews will automatically play for our selected headline articles and others will play when you hover your pointer over the article. Our goal has been to provide a faster, more engaging way to quickly see what is inside each Phase article.
Load More
→