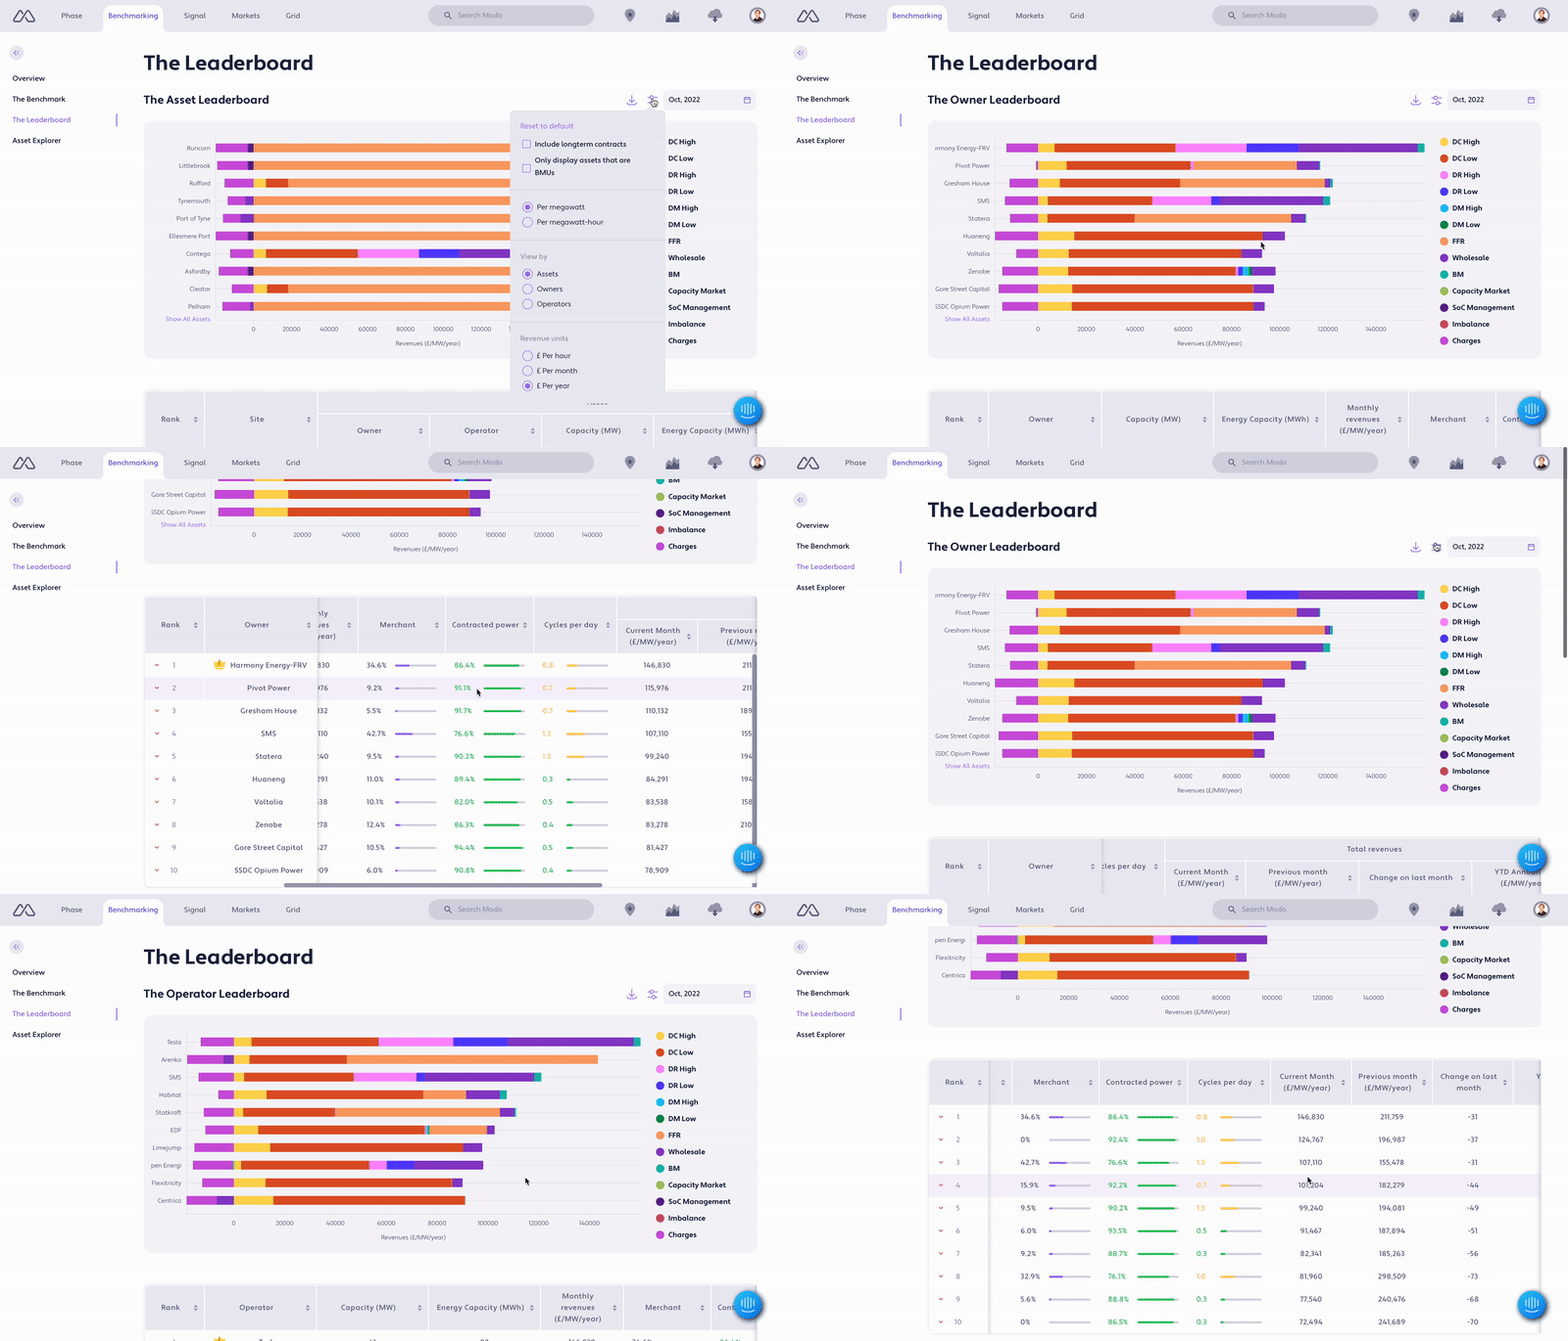
Until now, the Leaderboard has shown the performance of individual battery energy storage systems (BESS) across Great Britain. A tool so powerful that over 90% of BESS are owned and/or operated by its users.
But you wanted more. Loads of Modo users were taking the Leaderboard data and aggregating asset performance to compare owners and operators.
You can now step between views of the Leaderboard in seconds.
Assets. Owners. Operators.
Your full team can now instantly benchmark your own strategy without even mentioning Excel.
Interpreting the Leaderboard
A few important points:
Owner and Operator views only include the performance of Balancing Mechanism Units (BMUs).
The Leaderboard is a great indication of market performance. It can highlight how factors like risk appetite and age, size, and duration of assets can impact performance.
But there are details that aren’t included in the Leaderboard that can impact the real performance of these assets. For example, performance penalties for failing to deliver in accordance with Balancing Services’ requirements.
For more on what is and isn’t included in our benchmarking, we’d recommend you read Interpreting the Leaderboard.
If you’re looking at working with operators then we’d recommend checking out our series on choosing an operator.
If you ever have any questions on the Leaderboard or need support interpreting what’s being shown then please get in touch. We’re always happy to chat.
Show me the money (per hour and per year please!)
The Leaderboard currently updates once every month. And so we’ve always shown revenues in £/month. With our latest release you can now benchmark performance quickly in any conversation, and view revenues on a £/hour and £/year basis. Choose the units that make the most sense to you!

There’s more in the Leaderboard...
Other improvements we’ve made (all based on your feedback):
The methodology:
Charges (as shown in the Leaderboard chart) are now an aggregation of all Use of System charges - now including embedded export Transmission Network Use of System charges (TNUoS) from Triads.
We’ve made our throughput calculations more accurate (used in Asset Operations pages and in calculating Cycles per day in the Leaderboard), now using net traded volumes rather than export wholesale volumes.
We now calculate wholesale revenues using the average of the EPEX hourly and N2EX hourly Day Ahead auctions (previously, it was just the N2EX auction).
Revenues and costs due to imbalance are now shown as a distinct revenue stream for assets that aren’t registered as Balancing Mechanism Units (BMUs).
We’ve adjusted our assumption on round trip efficiency for calculating state of charge management for non-BMUs. Rather than assuming symmetric bi-directionally efficiencies of 92%, we now assume 85% on import and 99% on the export.
The experience:
Quickly see which assets are Balancing Mechanism Units (BMUs) and filter to only include BMUs.
With the Leaderboard graph making the revenue stack easier to understand, we’ve simplified the Leaderboard table by removing individual markets. Don't worry - these are still available to download. But it's now easier to see the headline figures (monthly revenues, merchant %, contracted power %, cycles, previous month, YTD annualised).
We’ve rounded revenues to the nearest £ (except when viewing revenues in hourly terms).
Changes to the benchmark:
The benchmark now only includes data taken from BMUs. We have a more accurate picture of what these assets are doing.
We've removed fixed Distribution Use of System (DUoS) charges and Capacity Market (CM) contracts from the benchmark figures. This will give a more accurate reference point when comparing day-to-day operations.
Historic benchmarks will be available (initially via the Modo team) and we will backdate all previous months using the new calculations.